Marketing campaigns generate more data than ever. More channels, more platforms, more touchpoints – and each tends to measure differently, with different data formats and reports.
The result is a growing pile of numbers spread across disconnected dashboards that someone has to pull together and clean up.
88% of marketers use AI tools daily – but most of that adoption is concentrated in content creation and automation. The data and analytics side remains paradoxically manual, and the time savings are arguably greatest.
Read on to learn six practical ways to bring AI into your campaign data workflow with tips for implementing them in your workflows right now.

Common Challenges With Campaign Data
Most major analytics platforms already offer AI-powered features, but most marketing teams aren’t using them or aren’t using them effectively. This is a problem because analytics is vital to everything in marketing, and it’s highly time-consuming.
According to a survey by Adverity and MarketingProfs, marketers spend 24% of their data-related time collecting data and another 19% cleaning it. Nearly half your analytics hours are burned before you’ve drawn a single insight.
However, that same study found 63% of that time could be partially or fully automated – so there’s a silver lining. All in all, the tools to fix these problems exist, but adoption hasn’t caught up. For teams willing to move early, that gap is an advantage.
1. Automate Data Collection and Unification
A study by Fluent covering 104 marketing agencies found that only 1 in 3 minutes of reporting time is devoted to insight generation. The rest is extraction, formatting, and QA. At the top end, agencies burn 60+ hours per client per month on reporting – and nearly half of that is repetitive.
This is firstly because channel data lives in its own world. Google Ads reports differently from Meta, which reports differently from your email platform, which reports differently from GA4, and so on.
Building a unified view means manually exporting, reconciling naming conventions, and hoping nothing breaks when you paste it all together.
How AI helps
AI-powered data platforms connect to your marketing tools and automatically pull everything into one place. They:
- Standardize metrics across platforms so you’re comparing like with like
- Reconcile naming conventions and campaign structures
- Keep dashboards updated in real time without manual refreshes
- Flag data quality issues before they corrupt your reporting
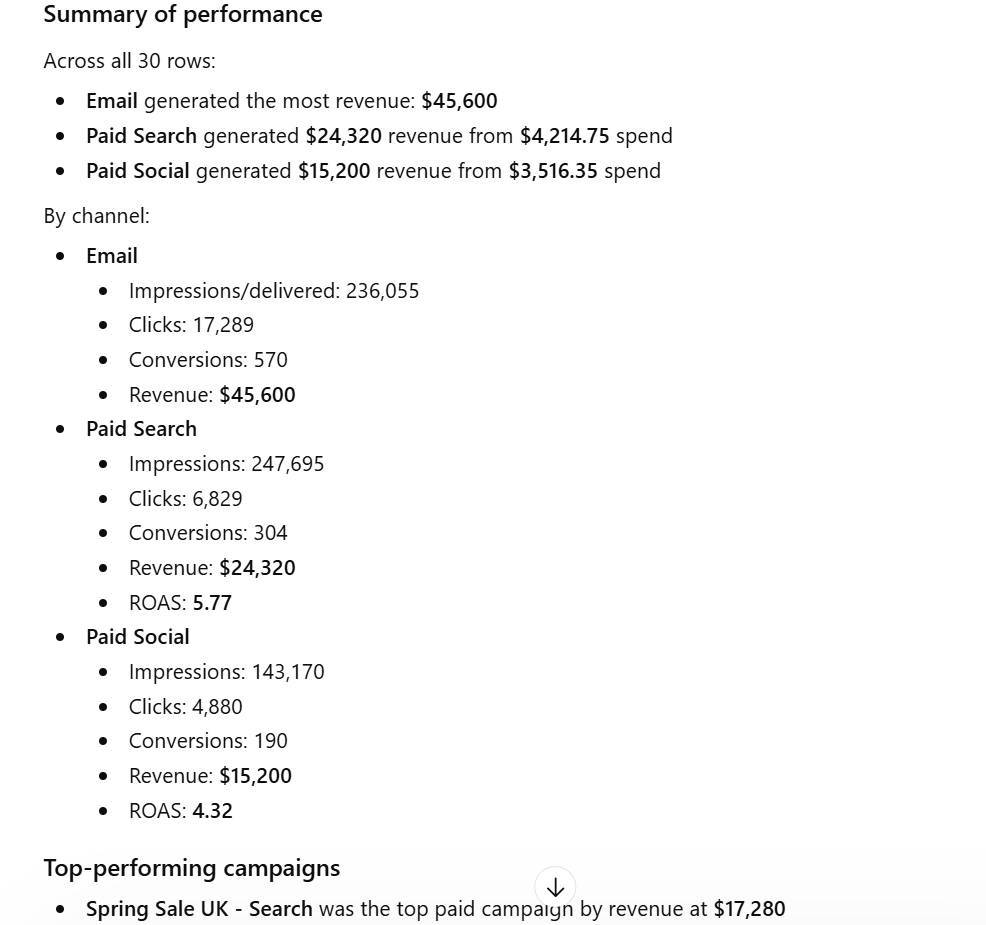
This can be achieved without dedicated AI tools. Export your campaign data from two or three sources, drop the CSVs into ChatGPT or Claude, and ask it to merge, clean, and summarize the combined dataset.
How to action it
Export your Google Ads, Meta, and email data as CSVs, drop them into ChatGPT or Claude, and ask it to reconcile naming conventions, merge the datasets, and provide a unified summary.
It won’t replace a proper data pipeline for ongoing reporting – but for a quick cross-channel view or a one-off analysis, it’s remarkably effective.
For something more permanent, GA4’s built-in AI features and Looker Studio’s Gemini integration are both free and underused. Funnel.io connects to 600+ data sources and cleans data before it reaches your BI tool if you need something more robust.
2. Use AI for Real-Time Performance Monitoring
Traditional dashboards visualize data and require you to log in and check them. AI-powered analytics tools interrogate your campaign data in real time, detecting performance decay, budget anomalies, and engagement drift long before they’d register your dashboard.
44% of marketers now analyze campaign performance weekly, according to HubSpot’s 2026 State of Marketing report. AI makes that cadence realistic even for lean teams, because the heavy lifting – pulling data, spotting patterns, highlighting what changed – is handled for you.
What this enables
Conversational analytics has matured quickly. Most major analytics platforms now let you type a plain-English question and get an answer with a chart without creating SQL queries.
AI-powered monitoring also gives you:
- Anomaly detection that flags unusual spend or performance patterns as they happen
- Auto-generated summaries explaining what changed and why
- Smart alerts delivered via Slack, email, or push notifications when KPIs move significantly
- The ability to query your data conversationally and get instant, contextual answers
How to action it
Turn on GA4’s automated insights feature. It’s already there, yet most teams don’t use it. Set up automated alerts for your most important campaign KPIs to get started.
For more advanced conversational analytics, Tableau Agent lets you explore data through natural-language prompts. Looker Studio Pro’s Gemini integration offers a free version of this within the Google ecosystem.
3. Predict Campaign Performance Before You Spend
While predictive analytics as a concept has been around for a decade or more, it’s now much easier to execute at every team and expertise scale.
Predictive analytics uses historical performance data – seasonal patterns, audience behaviors, channel trends – to forecast likely outcomes. Use it to plan ahead and anticipate changes and fluctuations so you can optimise your campaigns.
How AI helps
Export your last 12 months of campaign data and feed it into ChatGPT or Claude with a prompt like “identify patterns in this data and predict which campaign types are likely to perform best next quarter.”
You can prompt for trend analysis, specific recommendations, and visualizations. From there, you can:
- Simulate budget scenarios across channels before committing real money
- Identify which audience segments are most likely to convert based on historical behaviour
- Forecast the best windows for launches based on seasonal data
- Identify which content formats have historically driven the strongest results
Below is an example of analyzing channel performance in ChatGPT using 12 months of campaign data, including spend, clicks, conversions, revenue, and seasonality trends across channels.
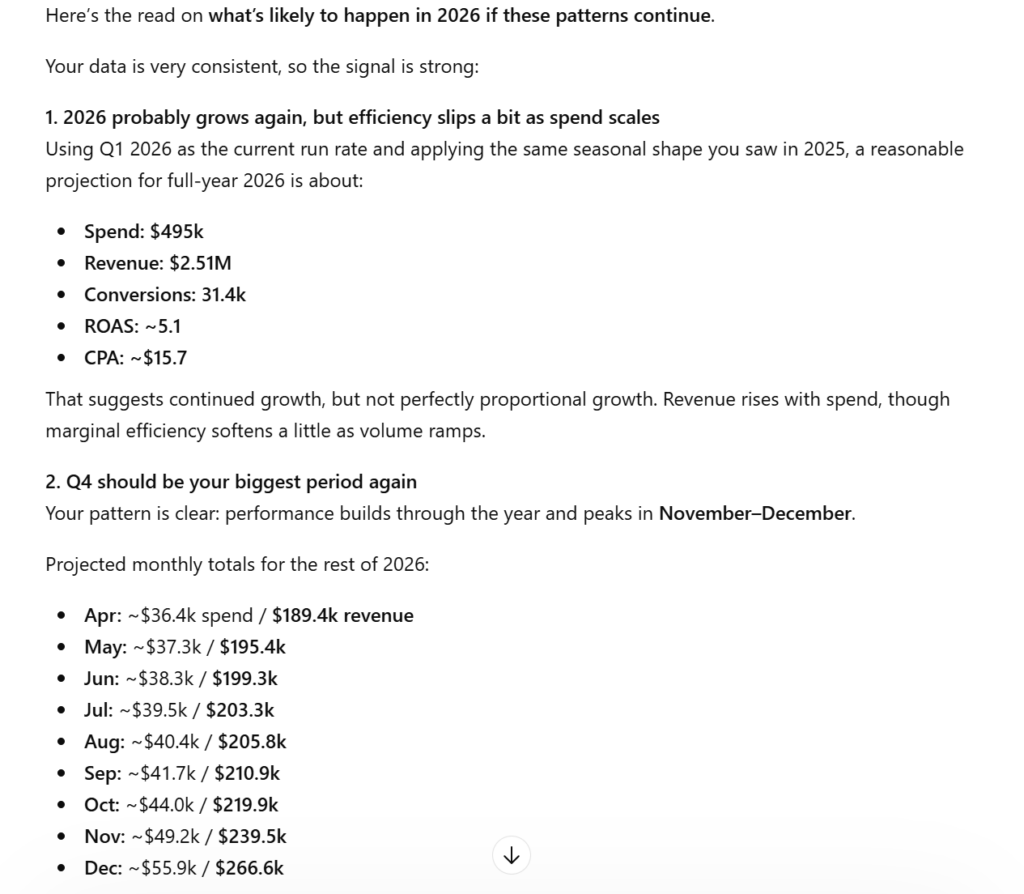
For more sophisticated forecasting, Tableau and ThoughtSpot both offer built-in predictive models. GA4’s predictive audiences use machine learning to identify users likely to convert or churn – which is useful for feeding into your targeting.
AI won’t catch everything, but it will surface patterns you’d miss scanning spreadsheets manually. You’ll need to spot-check the outputs for accuracy and treat them the same way you would any prediction.
4. Fix Attribution With Multi-Touch Models
The Supermetrics Marketing Data Report 2026, based on a survey of 435 marketers, found that a unified customer view and predictive analytics are the top two challenges for marketers, each cited by 34% of respondents. Attribution sits at the heart of both.
The problem is that the customer journey is rarely linear, and there are many more touchpoints than there used to be.
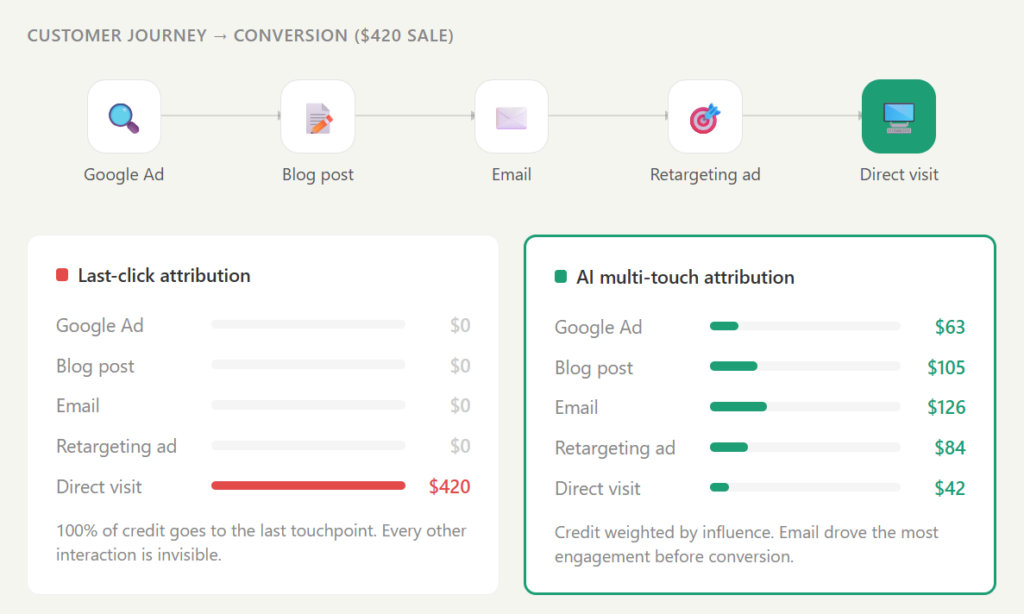
Someone sees an ad, reads a blog post, opens an email, clicks a retargeting ad, and then converts. Most attribution models give all the credit to the last touchpoint. Or split it evenly, which tells you even less.
How AI helps
AI-powered attribution models analyze the entire journey and assign weighted credit based on what influenced the conversion – a data-driven assessment rather than a rule someone made up. This changes where you spend:
- You see how organic content contributes to paid conversions even when it never gets the last click
- You move budget away from channels that look good on last-click reports but fail to drive outcomes
- Your forecasting improves, because better attribution data means better inputs for predictive models
- You can identify which touchpoints matter most at each stage of the funnel
How to action it
Review your current attribution model honestly. If you’re still using last-click or equal-credit, you’re making budget decisions on incomplete data. Most analytics and ad platforms now offer data-driven attribution options.
For B2B teams with longer sales cycles, connecting attribution to your CRM is where the real value is – HubSpot does this natively, tying marketing touchpoints to closed deals.
Either way, start by looking at which channels keep appearing in assisted conversions but never get credit under your current model. That’s where your budget is misallocated.
5. AI Support for Generating Your Reports and Summaries
You’ve collected the data, cleaned it, built the dashboards – and now you need to explain what it means to someone who doesn’t live in spreadsheets. Writing commentary, contextualizing results, answering the “so what?” – it’s skilled work, and it’s slow.
Fluent’s agency study found that commentary and formatting eat up the majority of reporting time. And 86% of marketers say AI saves them more than one hour daily on content-related tasks.
How AI can accelerate your reporting
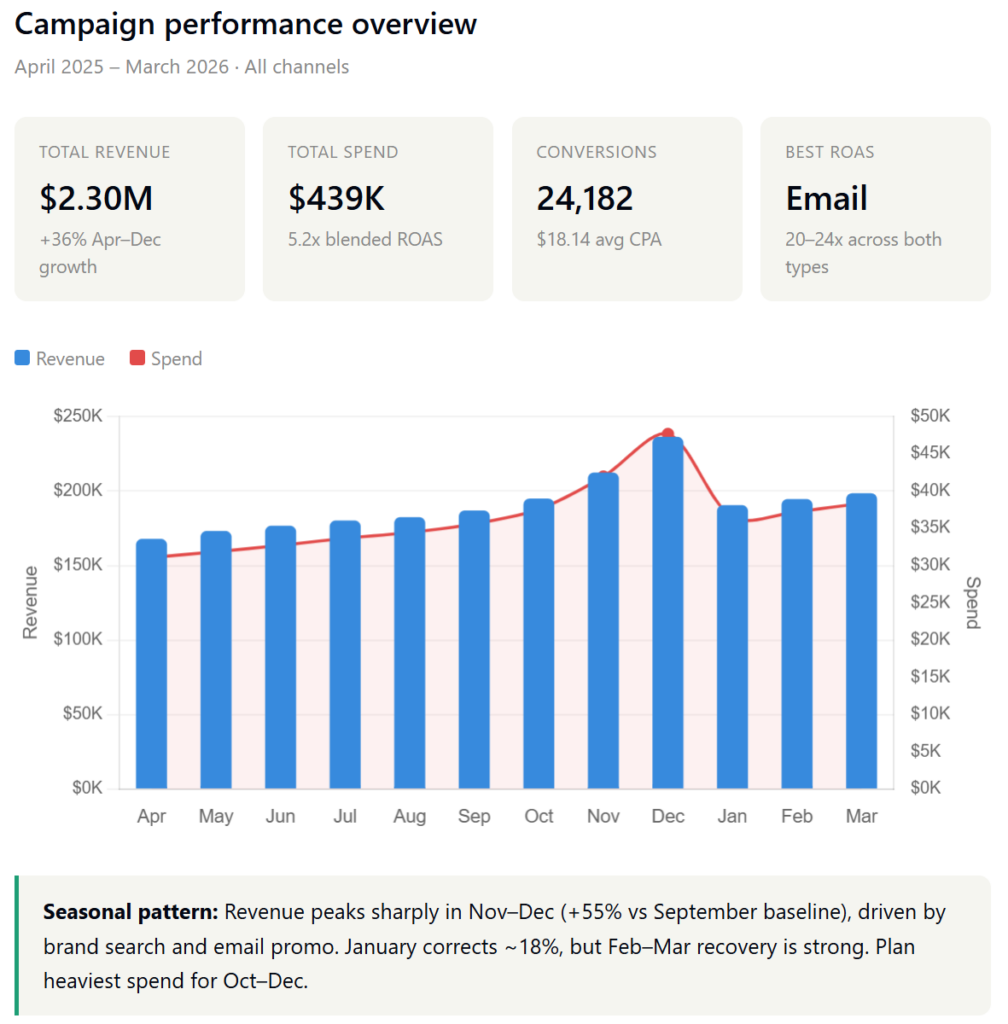
The most interesting development is visual reporting. Claude can generate interactive charts, dashboards, and infographics directly from your campaign data.
Feed in a CSV and ask it to build a visual breakdown of performance by channel, or a comparison of this quarter versus last. The outputs are interactive, shareable, and polished enough to drop straight into a client deck or stakeholder presentation. You can:
- Create infographics comparing campaign performance across channels and time periods
- Build interactive charts that stakeholders can explore themselves
- Generate branded visual summaries for client reports
- Turn raw data tables into clear, presentation-ready graphics in minutes
How to action it
Next time you need a campaign report, try building it visually in Claude. Export your data, upload the CSV, and ask it to create an infographic or an interactive chart that shows your key metrics, trends, and comparisons.
6. Sharpen Audience Segmentation and Personalization
Most teams segment their audiences by demographics. AI can analyze behavioral data at a scale and speed that manual segmentation can’t touch, creating micro-segments based on how people interact with your brand rather than broader, more generalized insights and intuition.
What this looks like in practice
HubSpot moved from broad segment-based email nurturing – grouping leads into categories like “marketing leads” or “sales leads” – to intent-based personalization using AI.
Their system predicts what each individual is trying to accomplish based on form responses, behavioural data, and website activity, then matches them to relevant content. The result was an 82% increase in conversion rates.
How AI helps with segmentation
The latest segmentation tools use machine learning to group customers by behavior, predicted actions, and engagement patterns – and most are accessible to small and mid-sized teams:
- Klaviyo offers predictive segmentation that groups customers by expected behavior – likely to churn, likely to buy again, expected spend
- Mailchimp builds predicted audiences based on purchase likelihood and customer lifetime value
- ActiveCampaign scores contacts and triggers automations based on behavioral patterns
- HubSpot uses Breeze AI to build segments directly from CRM data, matching leads to content based on intent signals
- Google Ads and Meta both offer AI-powered lookalike and predictive audiences natively within their ad platforms
How to action it
If you don’t have dedicated segmentation tools, you can export your customer data and feed it into ChatGPT or Claude. Ask it to identify behavioral clusters, meaning groups of users who interact with your brand in similar ways.
Below is an example of customer profiles created using the following:
- Email engagement: opens, clicks, unsubscribes, last active date
- Website behaviour: pages visited (especially pricing, product, blog), session frequency, time on site
- Purchase/conversion history: dates, amounts, products, frequency
- Some kind of customer ID tying it all together
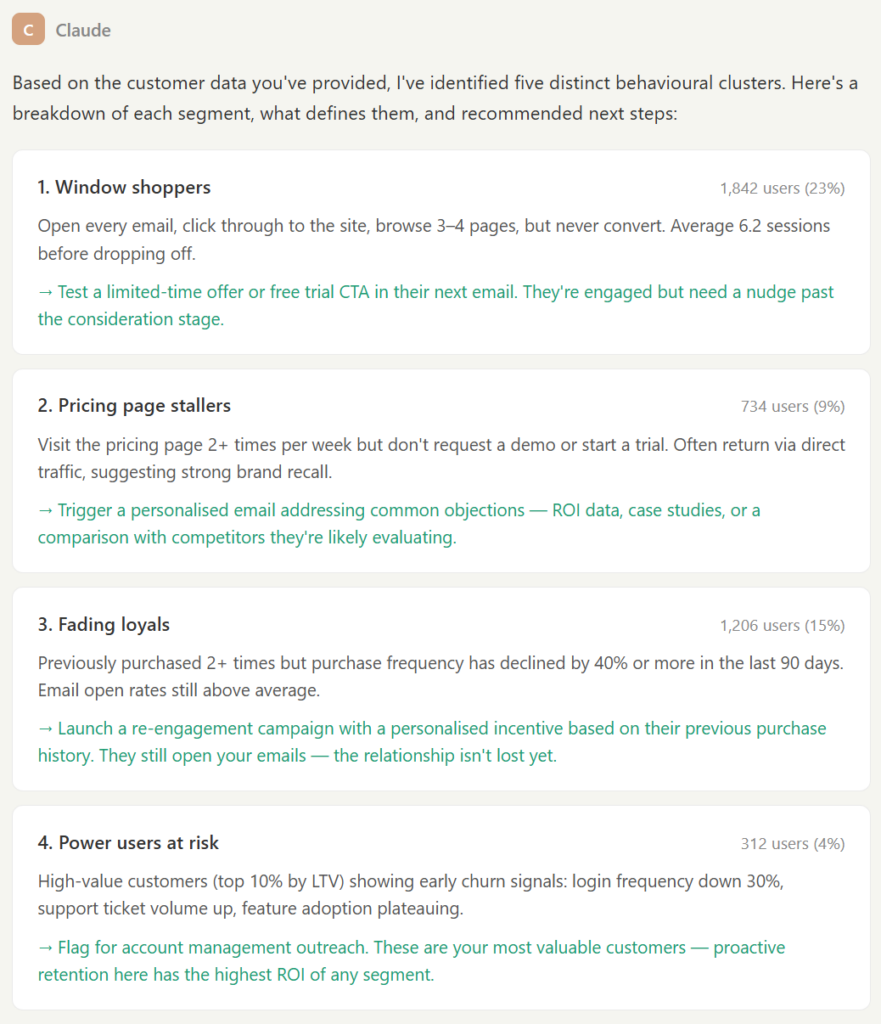
From there, build targeted messaging for each cluster and test against your current broad-segment campaigns.
Getting Started
The temptation is to overhaul every aspect of your reporting workflow, but it’s often best to start with a single pain point and work from there.
Audit how you spend your time each week and identify the biggest drain. Then export a campaign dataset, feed it into ChatGPT or Claude, and try:
- Merging data from multiple platforms into a single summary
- Generating a first-draft campaign report with key takeaways
- Building an infographic or interactive chart from raw performance data
- Running predictive prompts against your last 12 months of results|
Once you see the time difference in one report, the case for a wider roll out becomes clearer.
From there, it’s worth exploring purpose-built tools. We covered 10 of the best AI reporting tools in a recent article – from free options like Looker Studio to enterprise platforms like Tableau.
Or if you’re looking to learn more about using AI tools for marketing, register for our upcoming Virtual AI for Marketers Summit!