AI reporting tools have come a long way in the last couple of years. The best can generate entire reports from a text prompt, auto-flag anomalies, and translate complex datasets into clear, readable insights.
The move towards AI-powered reporting is accelerating across the board – from enterprise BI platforms adding conversational assistants to lightweight marketing tools that auto-generate client-ready dashboards in seconds.
But there are thousands of tools claiming to be “AI-powered,” and most of them aren’t worth your time.
We’ve explored the market across enterprise BI, agency reporting, and marketing-specific dashboards to find the 10 that are.

1. Tableau
Pricing: Tiered per-user plans (Viewer, Explorer, Creator) billed annually, with Viewer starting around $15/user/month. Some AI features require higher-tier bundles. See Tableau’s pricing page for current rates.
Best for: Enterprise-grade data visualization, cross-departmental reporting, advanced analytics
If there’s one name that’s been synonymous with data visualization for over a decade, it’s Tableau.
Originally born out of Stanford research, it’s now part of the Salesforce ecosystem – and the pioneering AI features have become more advanced and intuitive.
The headline addition for 2026 is Tableau Agent, an AI assistant that lets you query your data in natural language. Type something like “show me sales by region for Q1” and it’ll produce a graph in seconds. It handles data exploration, creates visualizations, and can perform calculations from simple prompts.
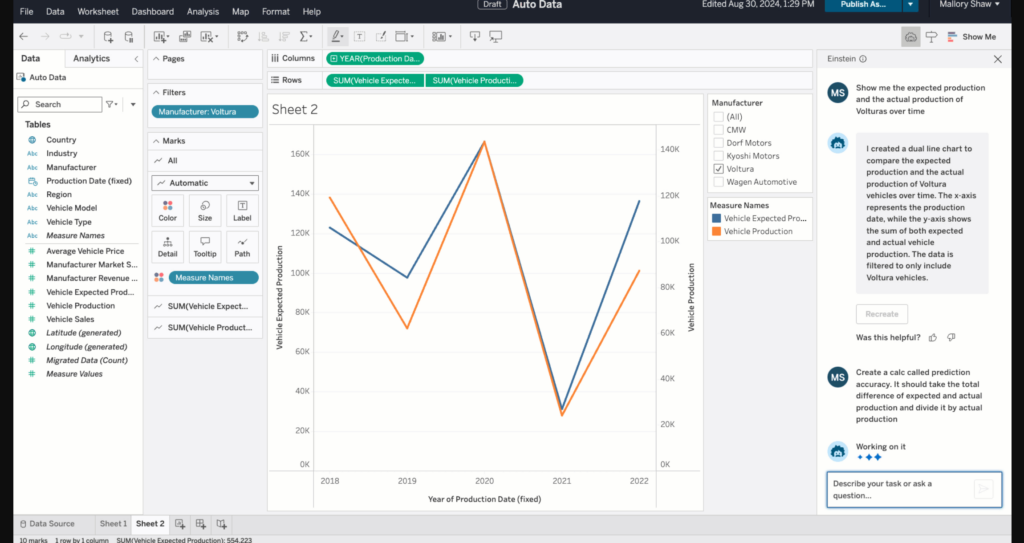
Then there’s Tableau Pulse, included with Tableau Cloud, which proactively delivers plain-language insights and metric alerts directly into your workflow. Instead of digging through dashboards, Pulse tells you what changed, why it matters, and whether your KPIs are on track.
Tableau also introduced “Tableau Next” – an agentic analytics platform that uses AI agents to analyze, share, and act on data autonomously. It’s early days, but it signals where enterprise BI is heading.
Beyond those core features, the AI toolkit includes:
- Automated clustering, forecasting, and anomaly detection built into dashboards
- Einstein Trust Layer for enterprise-grade data privacy across all AI features
- One-click insight sharing directly into Slack
- Multilingual support for global teams
- MCP Server integration for powering custom AI agents with Tableau data
Tableau’s pricing is layered, so costs can add up when you factor in Creator licenses for analysts, optional training, and infrastructure for self-hosted deployments. But if your business needs sophisticated cross-departmental reporting with deep visualization, it remains the benchmark.
The bottom line: Tableau is the gold standard for a reason. Unmatched visualization depth, a mature AI toolkit, and enterprise-grade governance make it the obvious choice for brands that need serious analytical firepower.
2. Microsoft Power BI
Pricing: Free tier available; Pro starts around $14/user/month, Premium Per User around $24/user/month. See Microsoft’s pricing page for current rates.
Best for: Teams embedded in the Microsoft ecosystem, cost-conscious enterprise reporting
Power BI is one of the most affordable BI tools on the market, and for teams already running Microsoft 365, the integration is seamless. It connects natively to Excel, Azure, SQL Server, Dynamics 365, and essentially everything in the Microsoft universe.
The AI features revolve around Copilot integration. Power BI Copilot can generate complete reports from natural language prompts, auto-create DAX formulas, summarize large datasets, and produce contextual narrative explanations alongside your visualizations. It’s particularly strong for teams that think in spreadsheets, as the interface feels like a natural extension of Excel.
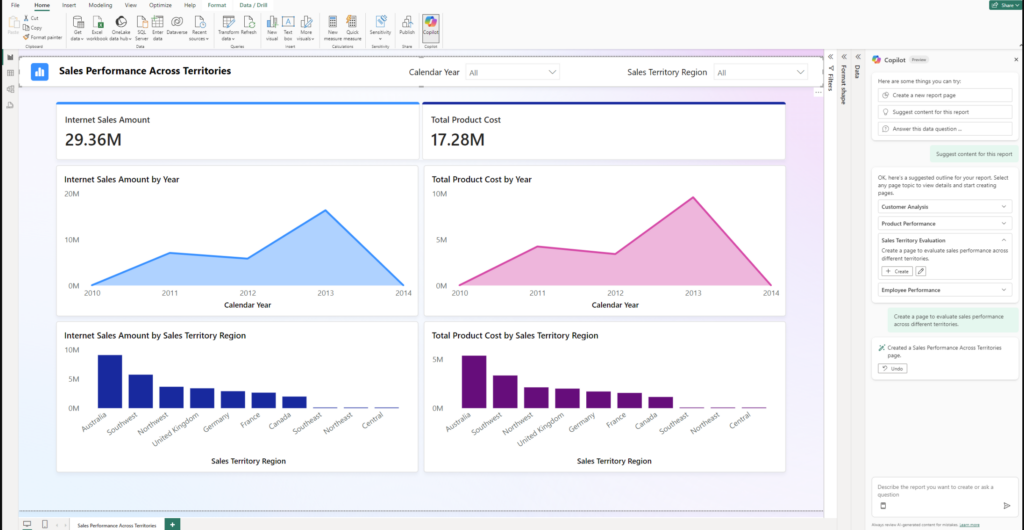
Key Influencers is another standout AI feature that automatically identifies statistically significant factors driving your chosen metrics. Ask it “what drives high-value deals?” and it’ll surface the variables that matter most. Other AI features worth knowing about:
- Anomaly Detection for flagging unusual patterns in time-series data
- Smart Narratives that auto-generate plain-English explanations of your charts
- Deep integration with Microsoft Fabric for unified data engineering and analytics
The bottom line: Unbeatable value for Microsoft shops. If your team already lives in Excel and Teams, Power BI is the natural choice for AI-assisted reporting without a massive budget.
3. Looker Studio
Pricing: Free for core features; Looker Studio Pro available for additional collaboration and governance. Third-party connectors may add costs.
Best for: Small teams, freelancers, anyone heavy on Google’s ecosystem
Looker Studio (formerly Google Data Studio) remains the go-to free reporting tool for marketers. If you’re running Google Ads, GA4, YouTube, and Search Console, everything connects natively at zero cost.
The drag-and-drop report builder is intuitive for non-technical marketers, and you can create custom charts, blend data from multiple sources, and apply filters to build interactive dashboards. Over 50 pre-built templates let you get started rapidly, and 1,200+ connectors are available in the marketplace if you need to pull in non-Google data.
On the AI front, Looker Studio Pro subscribers get access to Gemini-powered features that bring it closer to the bigger BI platforms. Conversational Analytics lets you ask questions about your data in natural language and receive charts or tables. A Google Slides integration auto-imports your charts with AI-generated summaries for presentations.
For teams that need more firepower, the enterprise sibling Looker adds semantic modeling, governance, and deep Google Cloud integration.
The bottom line: If your reporting needs are Google-centric and you don’t need AI bells and whistles, Looker Studio gets the job done while preserving your budget.
4. Whatagraph
Pricing: Self-serve plans available with a free starting option. See Whatagraph’s pricing page for current tiers.
Best for: Marketing agencies, multi-channel performance reporting, client-facing dashboards
Whatagraph has been impressing with its AI features, offering a real contender to the big guns in data analytics and BI. The platform’s headline feature, Whatagraph IQ, lets you generate full marketing reports from a simple text prompt. Describe what you need, and the AI creates complete reports The platform’s headline feature, Whatagraph IQ, lets you generate full marketing reports from a simple text prompt. Describe what you need, and the AI creates complete reports with widgets, layouts, and styling – all pulled from your connected data.
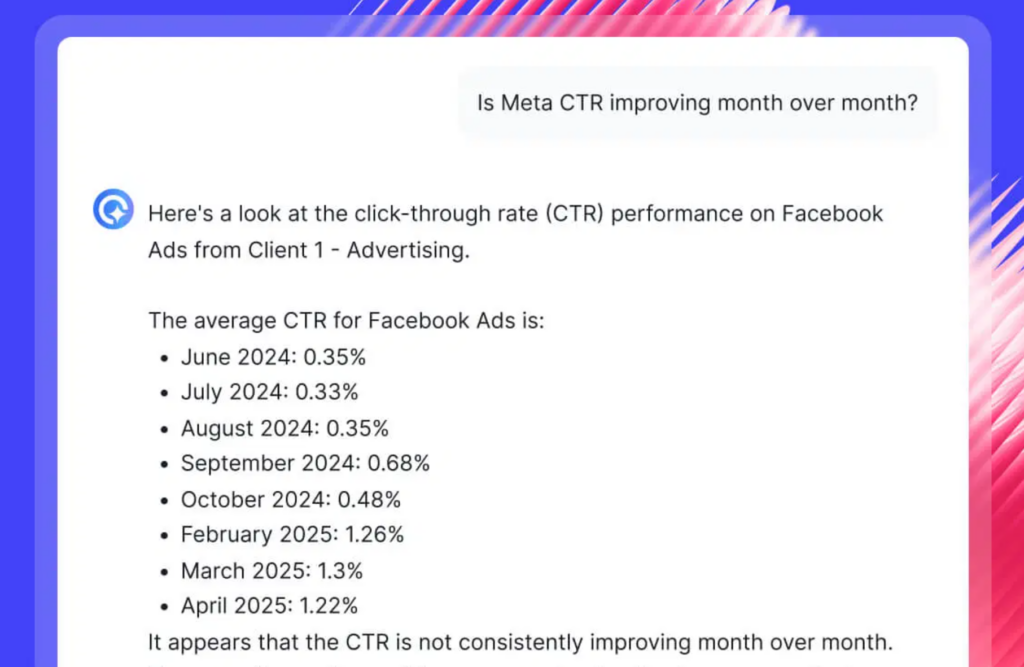
The broader IQ suite includes:
- IQ Chat for conversational follow-up questions about your data
- AI-powered summaries explaining what changed, why, and what needs attention
- Auto-generated custom dimensions from text prompts
- 55+ fully managed marketing integrations
For marketing, there are some smart features. Upload a screenshot of your client’s website or brand guidelines, and Whatagraph IQ auto-detects the fonts, colors, and styling to apply across the report.
The bottom line: If you’re an agency drowning in client reports, Whatagraph’s AI-first model could transform your workflow. It’s a rising star in AI-powered analytics, offering unique yet neat features.
5. Funnel.io
Pricing: Flexpoint-based model with tiered plans. See Funnel’s pricing page for current options.
Best for: Data-driven teams needing clean, unified marketing data pipelines
Funnel takes a different angle on reporting. Rather than being a dashboarding tool first, it’s a marketing data hub that collects, cleans, and harmonizes data from 600+ connectors before sending it wherever you need it – Looker Studio, Power BI, Tableau, BigQuery, or its own built-in dashboards.
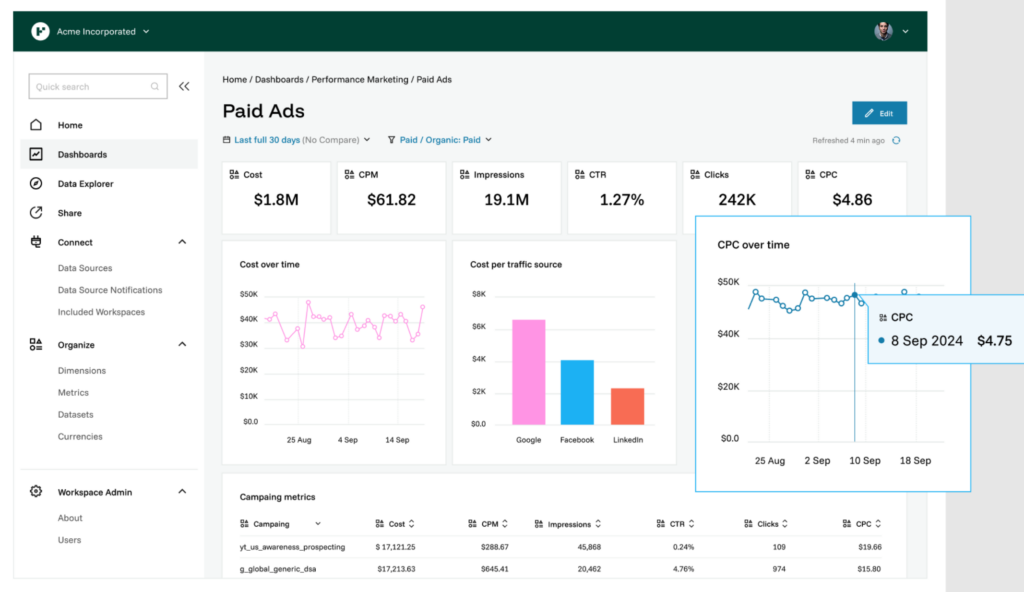
The AI capabilities center on anomaly detection and automated insights. Funnel monitors your campaign performance and flags unusual patterns, like sudden drops in conversion rates or unexpected spend spikes. It’s reportedly highly reliable, too.
The trade-off is that Funnel isn’t primarily a visualization tool. Many users pair it with a separate dashboarding platform, which adds complexity. Flexpoint-based pricing can also become unpredictable at scale when connecting high-volume data sources.
The bottom line: If data quality is your bottleneck rather than visualization, Funnel solves the hard part – getting clean, reliable, unified data – and lets you visualize it however you want.
6. AgencyAnalytics
Pricing: Tiered plans (Freelancer, Agency, Agency Pro) with per-client pricing. See AgencyAnalytics’ pricing page for current rates.
Best for: Marketing agencies managing SEO, PPC, and social reporting for multiple clients
AgencyAnalytics is purpose-built for marketing agencies, and it shows. The platform integrates with 80+ marketing platforms and generates automated reports that can be white-labeled, branded, and scheduled for automatic delivery to clients.
Some standout features are built-in SEO tools bundled directly into the reporting platform, so you don’t need separate subscriptions for SEMrush or Ahrefs just to populate basic SEO metrics in your client reports. On the AI side, the toolkit includes:
- Ask AI: Query your dashboard data conversationally and get data-backed answers and recommendations
- AI Widget Summaries: Auto-generated plain-language summaries for charts and graphs
- Smart Reports: AI-generated presentation-ready reports from your campaign data
The pricing model is client-based with per-client surcharges above the included limits, so costs scale as your roster grows. There’s a 14-day free trial to get started with.
The bottom line: If you’re a boutique or mid-sized agency focused on SEO and PPC, AgencyAnalytics consolidates reporting and auditing into a single, client-friendly platform.
7. DashThis
Pricing: Dashboard-based pricing tiers starting around $49/month. See the DashThis pricing page for current plans and limits.
Best for: Small teams and agencies wanting fast, template-based marketing dashboards
DashThis is a true “plug and play” option. It’s designed for marketers who want clean, professional dashboards without spending hours on setup. Connect your data sources, pick a pre-built template (SEO, PPC, social, email – they’ve got 37+), and you’re essentially done.
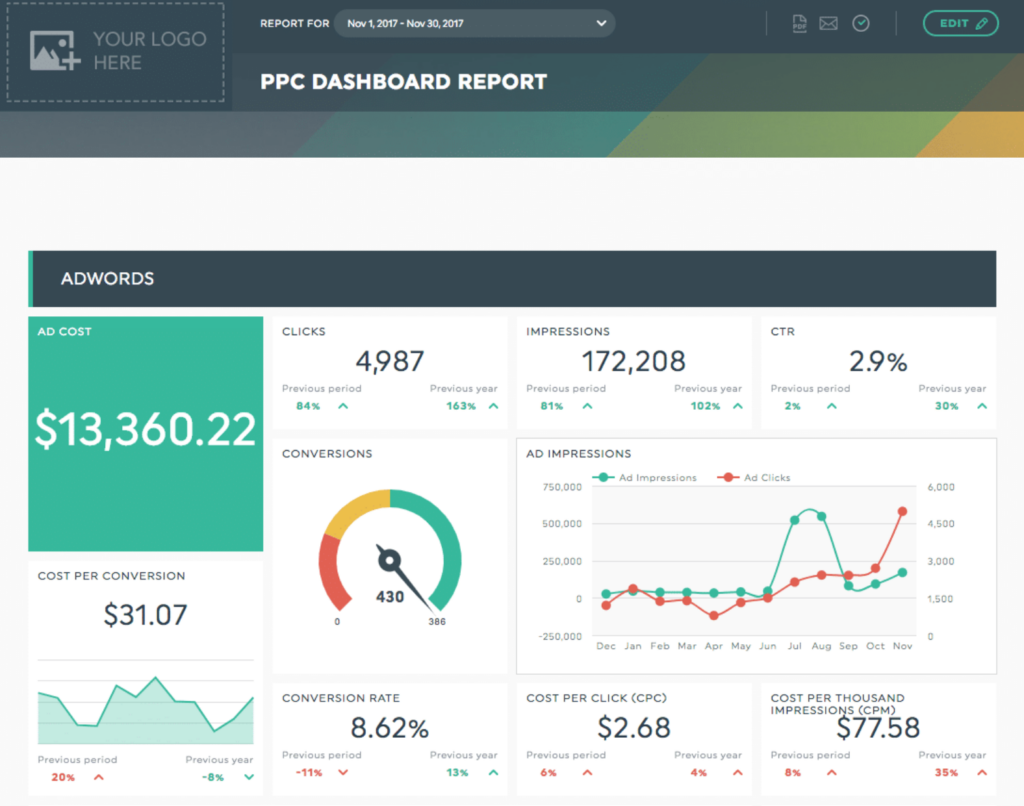
The AI Insights Pro feature, launched in late 2025, adds chat-based analysis and dashboard context to deliver more personalized marketing insights. All plans include unlimited users, and white-labeling is available on higher tiers.
DashThis is best suited to teams focused on making access to simple marketing KPIs easy. If that’s your world, it’s one of the fastest ways to get professional reports ready and usable.
The bottom line: If speed and simplicity beat depth and customization for your use case, DashThis is hard to beat. Perfect for freelancers and small agencies that need professional-looking reports without the learning curve.
8. Databox
Pricing: Tiered plans available; free trial offered. See Databox’s pricing page for current options.
Best for: Internal teams tracking KPIs across business functions
Databox positions itself as the real-time KPI dashboard for growing businesses. It connects to 100+ data sources and visualizes metrics using pre-built “databoards” – mobile-friendly dashboards designed for quick performance monitoring.
What sets Databox apart is its emphasis on goal tracking and alerts. Set KPI targets, and Databox notifies your team via Slack, email, or push notification when performance trends up or down. Higher tiers add forecasting and AI-generated summaries for more proactive insights.
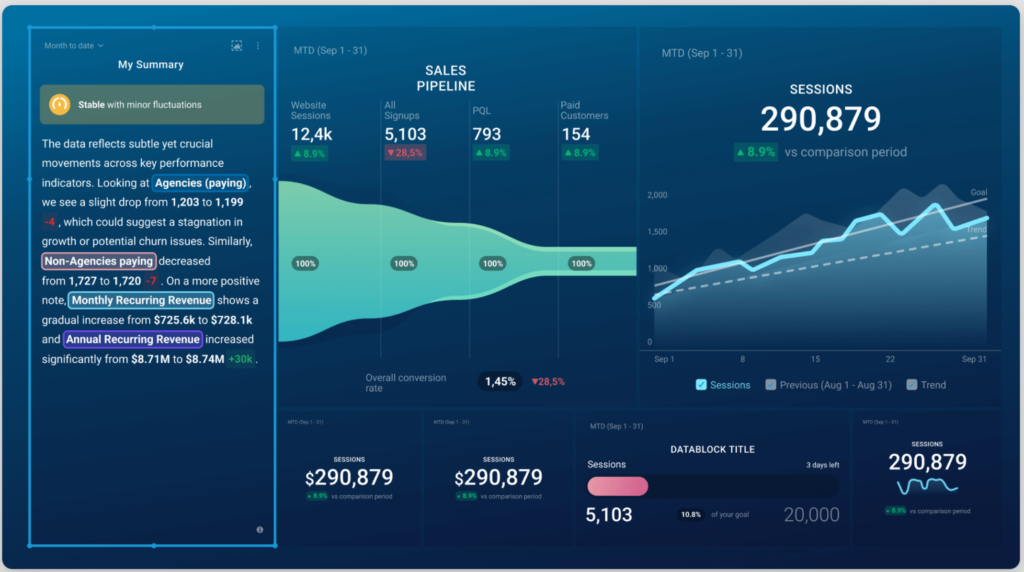
Benchmark Groups are worth mentioning – you can compare your metrics against anonymized industry data to see how you compare. The interface is clean and quick to set up, though the visualization options and customization are perhaps more limited than the main contenders. The interface itself looks excellent, however.
The bottom line: For internal marketing teams looking to monitor performance in real time and benchmark against their industry, Databox delivers fast, actionable visibility.
9. Klipfolio
Pricing: Two products (PowerMetrics and Klips) with separate pricing tiers. See Klipfolio’s pricing page for current rates.
Best for: Semi-technical teams that need highly customizable dashboards
Klipfolio offers two products: PowerMetrics for metric tracking and Klips for custom dashboards. It’s built for teams that want more control over how their data is displayed and calculated.
The platform supports 100+ data sources, including REST APIs and direct database connections. Users can apply custom formulas, build calculated metrics, and style dashboards with HTML and CSS. AI insights are available on enterprise tiers, providing automated analysis and recommendations.
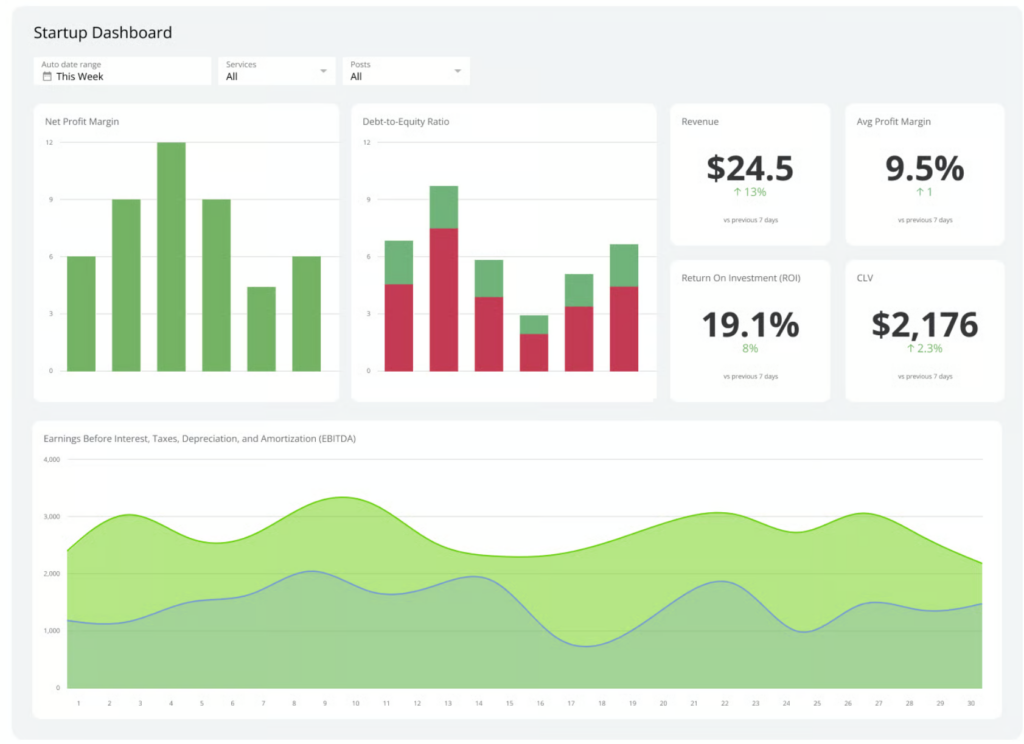
Klipfolio is particularly well-suited for teams that straddle the line between marketing and data analytics.
You get enough flexibility to build sophisticated dashboards without needing a full BI platform. The trade-off is a steeper learning curve, and performance can lag with complex dashboards loading multiple data sources simultaneously.
The bottom line: If your team has some technical chops, Klipfolio hits a sweet spot between simplicity and BI-level flexibility.
10. ThoughtSpot
Pricing: Essentials from around $25/user/month; Pro from around $50/user/month (billed annually). Enterprise pricing is custom. See ThoughtSpot’s pricing page for current plans.
Best for: Teams that want AI-first, search-driven analytics without relying on analysts to build every report
ThoughtSpot has positioned itself as the AI-native alternative to traditional BI. The core idea is simple – instead of building dashboards and waiting for analysts, anyone on your team can type a question and get an answer.
The platform’s AI agent, Spotter, is the centerpiece. It can run multi-step analyses, surface anomalies, identify correlations, and proactively flag trends you haven’t asked about yet. It learns and adapts based on how your team interacts with data, getting more useful over time.
In February 2026, ThoughtSpot launched the next generation of Analyst Studio, adding SpotCache for unlimited query usage at fixed cloud costs, a native spreadsheet interface for data prep, and a data prep agent that bridges flexibility with enterprise governance. Other notable features include:
- Augmented Dashboards (Liveboards) with built-in AI that surfaces key trends and drivers automatically
- Embedded analytics with developer-friendly APIs for integrating insights into your own products
- Automated anomaly detection and correlation analysis across datasets
- Powerful security, audit controls, and enterprise-grade governance
ThoughtSpot is priced at the enterprise end of the spectrum, and the platform requires solid data modelling to get the best results from its AI-powered search.
The bottom line: ThoughtSpot flips the traditional BI model on its head. Instead of analysts building reports for everyone else, everyone can explore data themselves. If self-serve analytics is the goal, this is purpose-built for it.
Building Your AI Reporting Stack
The best reporting tool ultimately depends on your business, industry, budget, and use cases.
- Need robust, enterprise-grade visualization? Tableau or Power BI is a natural fit.
- Running a marketing agency? Whatagraph or AgencyAnalytics could suit.
- Small team, tight budget? Looker Studio or DashThis are worth exploring.
- Want bulletproof data pipelines feeding into any BI tool? Funnel.io has superb utility.
- Tracking KPIs with industry benchmarks? Databox delivers real-time visibility.
- Need customizable dashboards with technical flexibility? Klipfolio hits that middle ground.
- Ready for AI-first, self-serve analytics at scale? ThoughtSpot is purpose-built for it.
In all cases, the goal is clearer insights with less manual work. You’re not replacing your analytics team with AI, but giving them the leverage to focus on strategy instead of spreadsheets.
Want to learn more about AI tools for marketers? Register for our upcoming Virtual AI for Marketers Summit!
Here are some similar articles you might enjoy:
- Top 10 AI Tools Every Marketer Should Be Using (Free + Paid)
- How Marketers Can Use AI to Simplify Campaign Data and Analytics
- How to Build Ethical, Brand-Safe AI Guidelines for Your Marketing Team